On November 30,2020,China International Import Expo released the China Dairy Products Import Situation Report,which is divided into two parts,the first part is the illustration of the overall import situation of dairy products in China,and the last part is the introduction of the import situation of different categories of dairy products. This time,we will illustrate overall import situation of dairy products in China first.
Overall import situation of dairy products in China
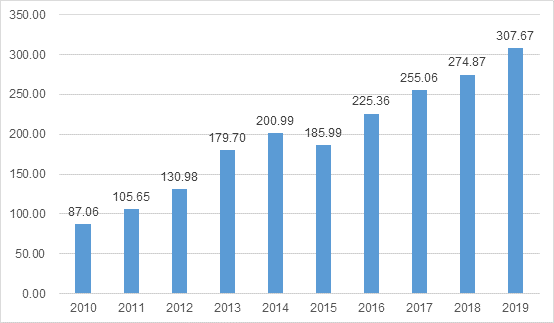
The Report mentioned that in 2019,China imported 3.077 million tons of dairy products,up 11.9% year-on-year,with a value of $11.64 billion,up 10.2% year-on-year. From 2010 to 2019,the average annual compound growth rate of dairy imports is 16.5%.
Figure 1:Changes in the value of imported dairy products from 2010 to 2019 (unit:100 million U.S. dollar)
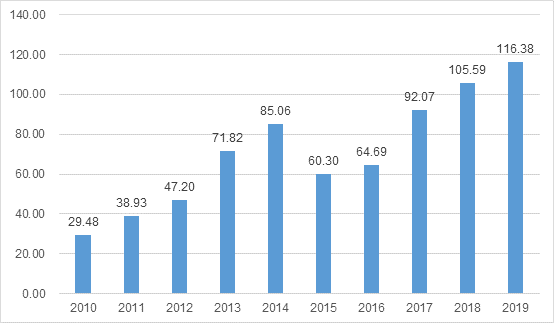
Figure 2:Changes in the import volume of dairy products from 2010-2019 (unit:10 thousand tons)
In 2019,by import value,the volume of retail packaged infant formula milk powder is 345 thousand tons,up 6.5% year-on-year,and the value is $5.19 billion,up 8.9% year-on-year;the volume of imported whole milk powder is 671 thousand tons,up 28.8% year-on-year,and the value is $2.25 billion,up 23.8% year-on-year;the volume of imported milk is 891 thousand tons,up 32.3% year-on-year,the value is $1.1 billion,up 20.7% year-on-year;the volume of imported skimmed milk powder is 344 thousand tons,up 22.6% year-on-year,the value is $870 million,up 43.1% year-on-year;the volume of cheese is 115 thousand tons,up 6.1% year-on-year,the value is $520 million,up 1.8% year-on-year;the volume of imported butter is 8.5 thousand tons,down 24.6% year-on-year,the value is $470 million,and down 33.1% year-on-year.
Figure 3:The value of import for dairy products by category in 2019 and year-on-year
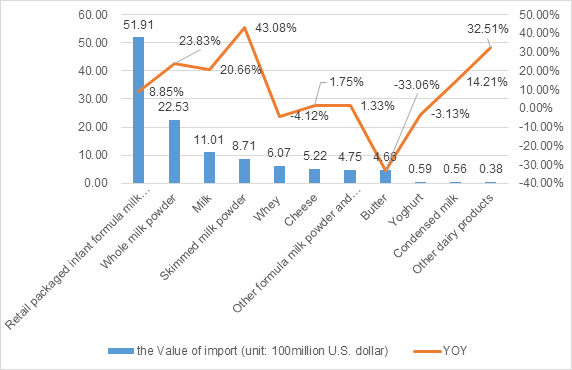
Figure 4:The proportion of the value of import for dairy products by category in 2019
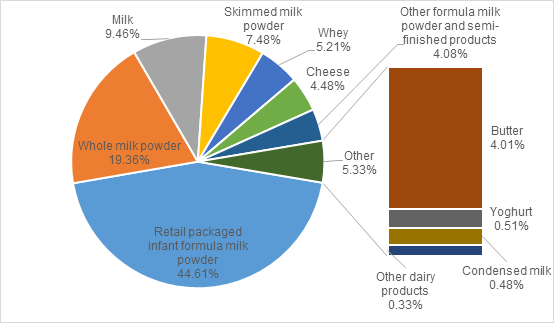
Figure 5:The Import volume of dairy products by category in 2019 and year-on-year
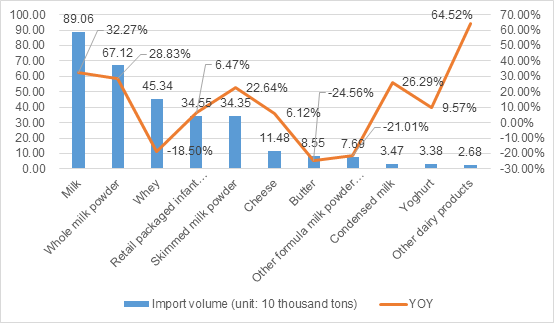
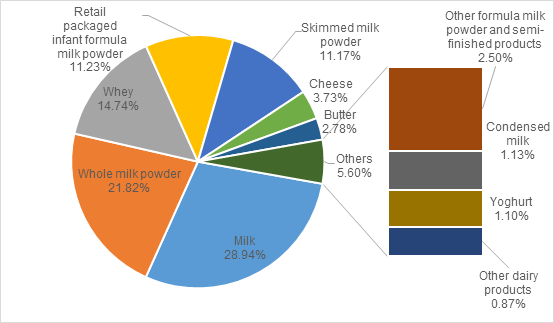
Figure 6:The proportion of import volume of dairy products by category in 2019
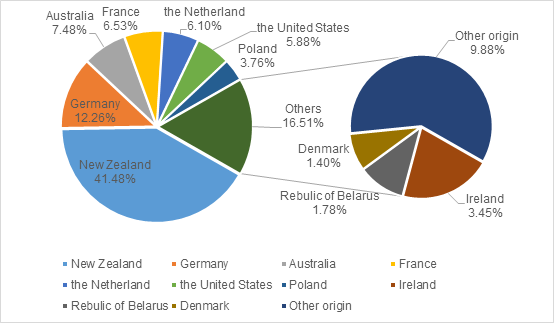
In 2019,among the sources of imported dairy products in China,the top three by the value of import are New Zealand,the Netherlands and Ireland. There are 1.276 million tons of dairy products from New Zealand with value of $4.74 billion,0.188 million tons of dairy products from the Netherland with value of $1.85 billion,and 0.106 million tons of dairy products from Ireland with value of $0.95 billion.
Figure 7:The value of import for dairy products by origin in 2019 and year-on-year

Figure 8:The proportion of the value of import for dairy products by origin in 2019
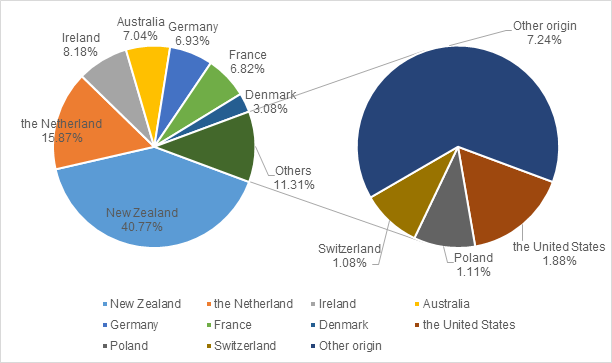
Figure 9:The import volume of dairy products by origin in 2019 and year-on-year
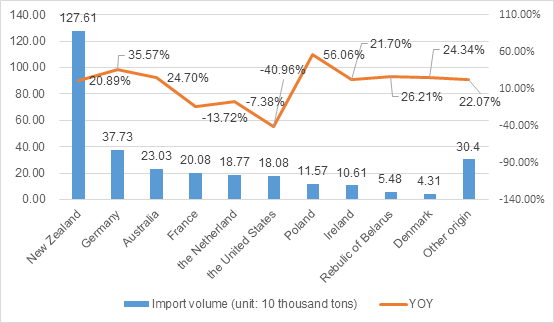
Figure 10:The proportion of import volume of dairy products by origin in 2019
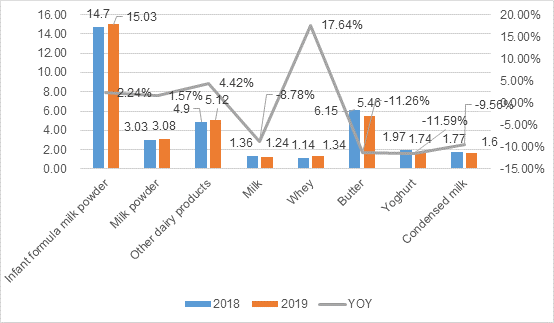
In 2019,the highest average unit price among the main varieties of dairy product imported into China is retail packaged infant formula milk powder,with an average unit price of $14.7/kg,up 2.2% year-on-year.
Figure 11:The average unit price of dairy products by category in 2018 & 2019 and year-on-year
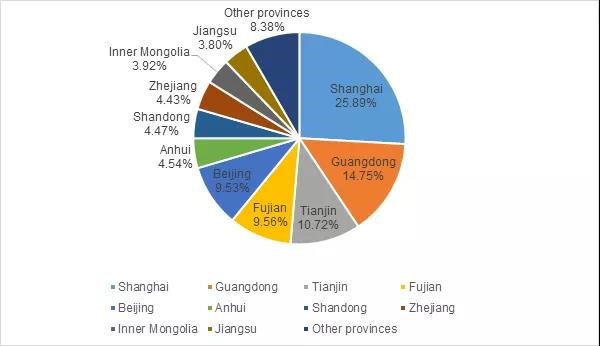
In 2019,the top three provinces and cities in terms of dairy import turnover are Shanghai,Guangdong and Tianjin. Among them,Shanghai imported 797 thousand tons with the value of import of $3.09 billion,Guangdong imported 454 thousand tons with the value of import of $2.95 billion,and Tianjin imported 330 thousand tons with the value of import of $ 1 billion. On a year-on-year basis,among the top ten provinces and cities in terms of import volume,the fastest-growing is Inner Mongolia,with a 51% year-on-year increase.
Figure 12:The value of import for dairy products by province in 2019
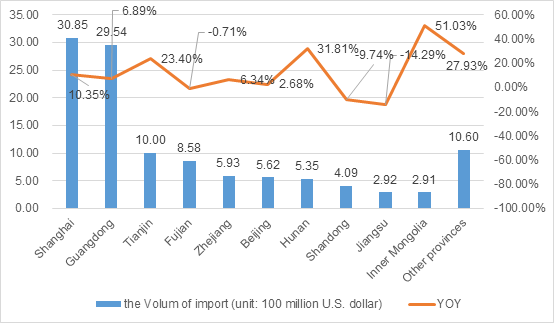
Figure 13:The proportion of value of import for dairy products by province in 2019
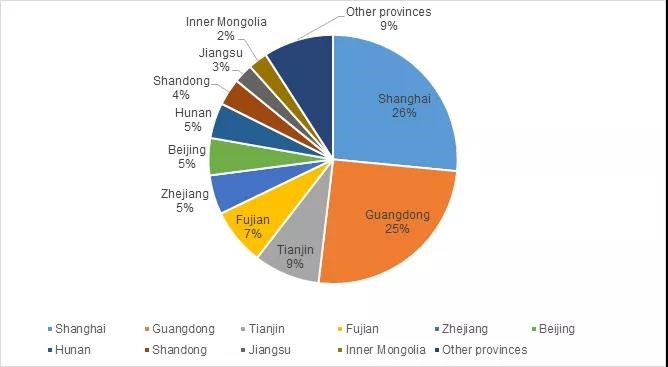
Figure 14:The import volume of dairy products by province in 2019 and year on year
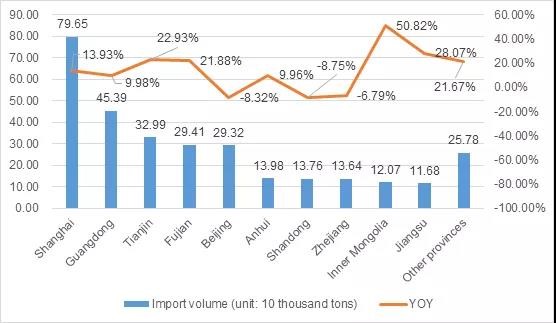
Figure 15:The proportion of import volume of dairy products by province in 2019
Next week,we will release the last part of the Report,please follow us!